

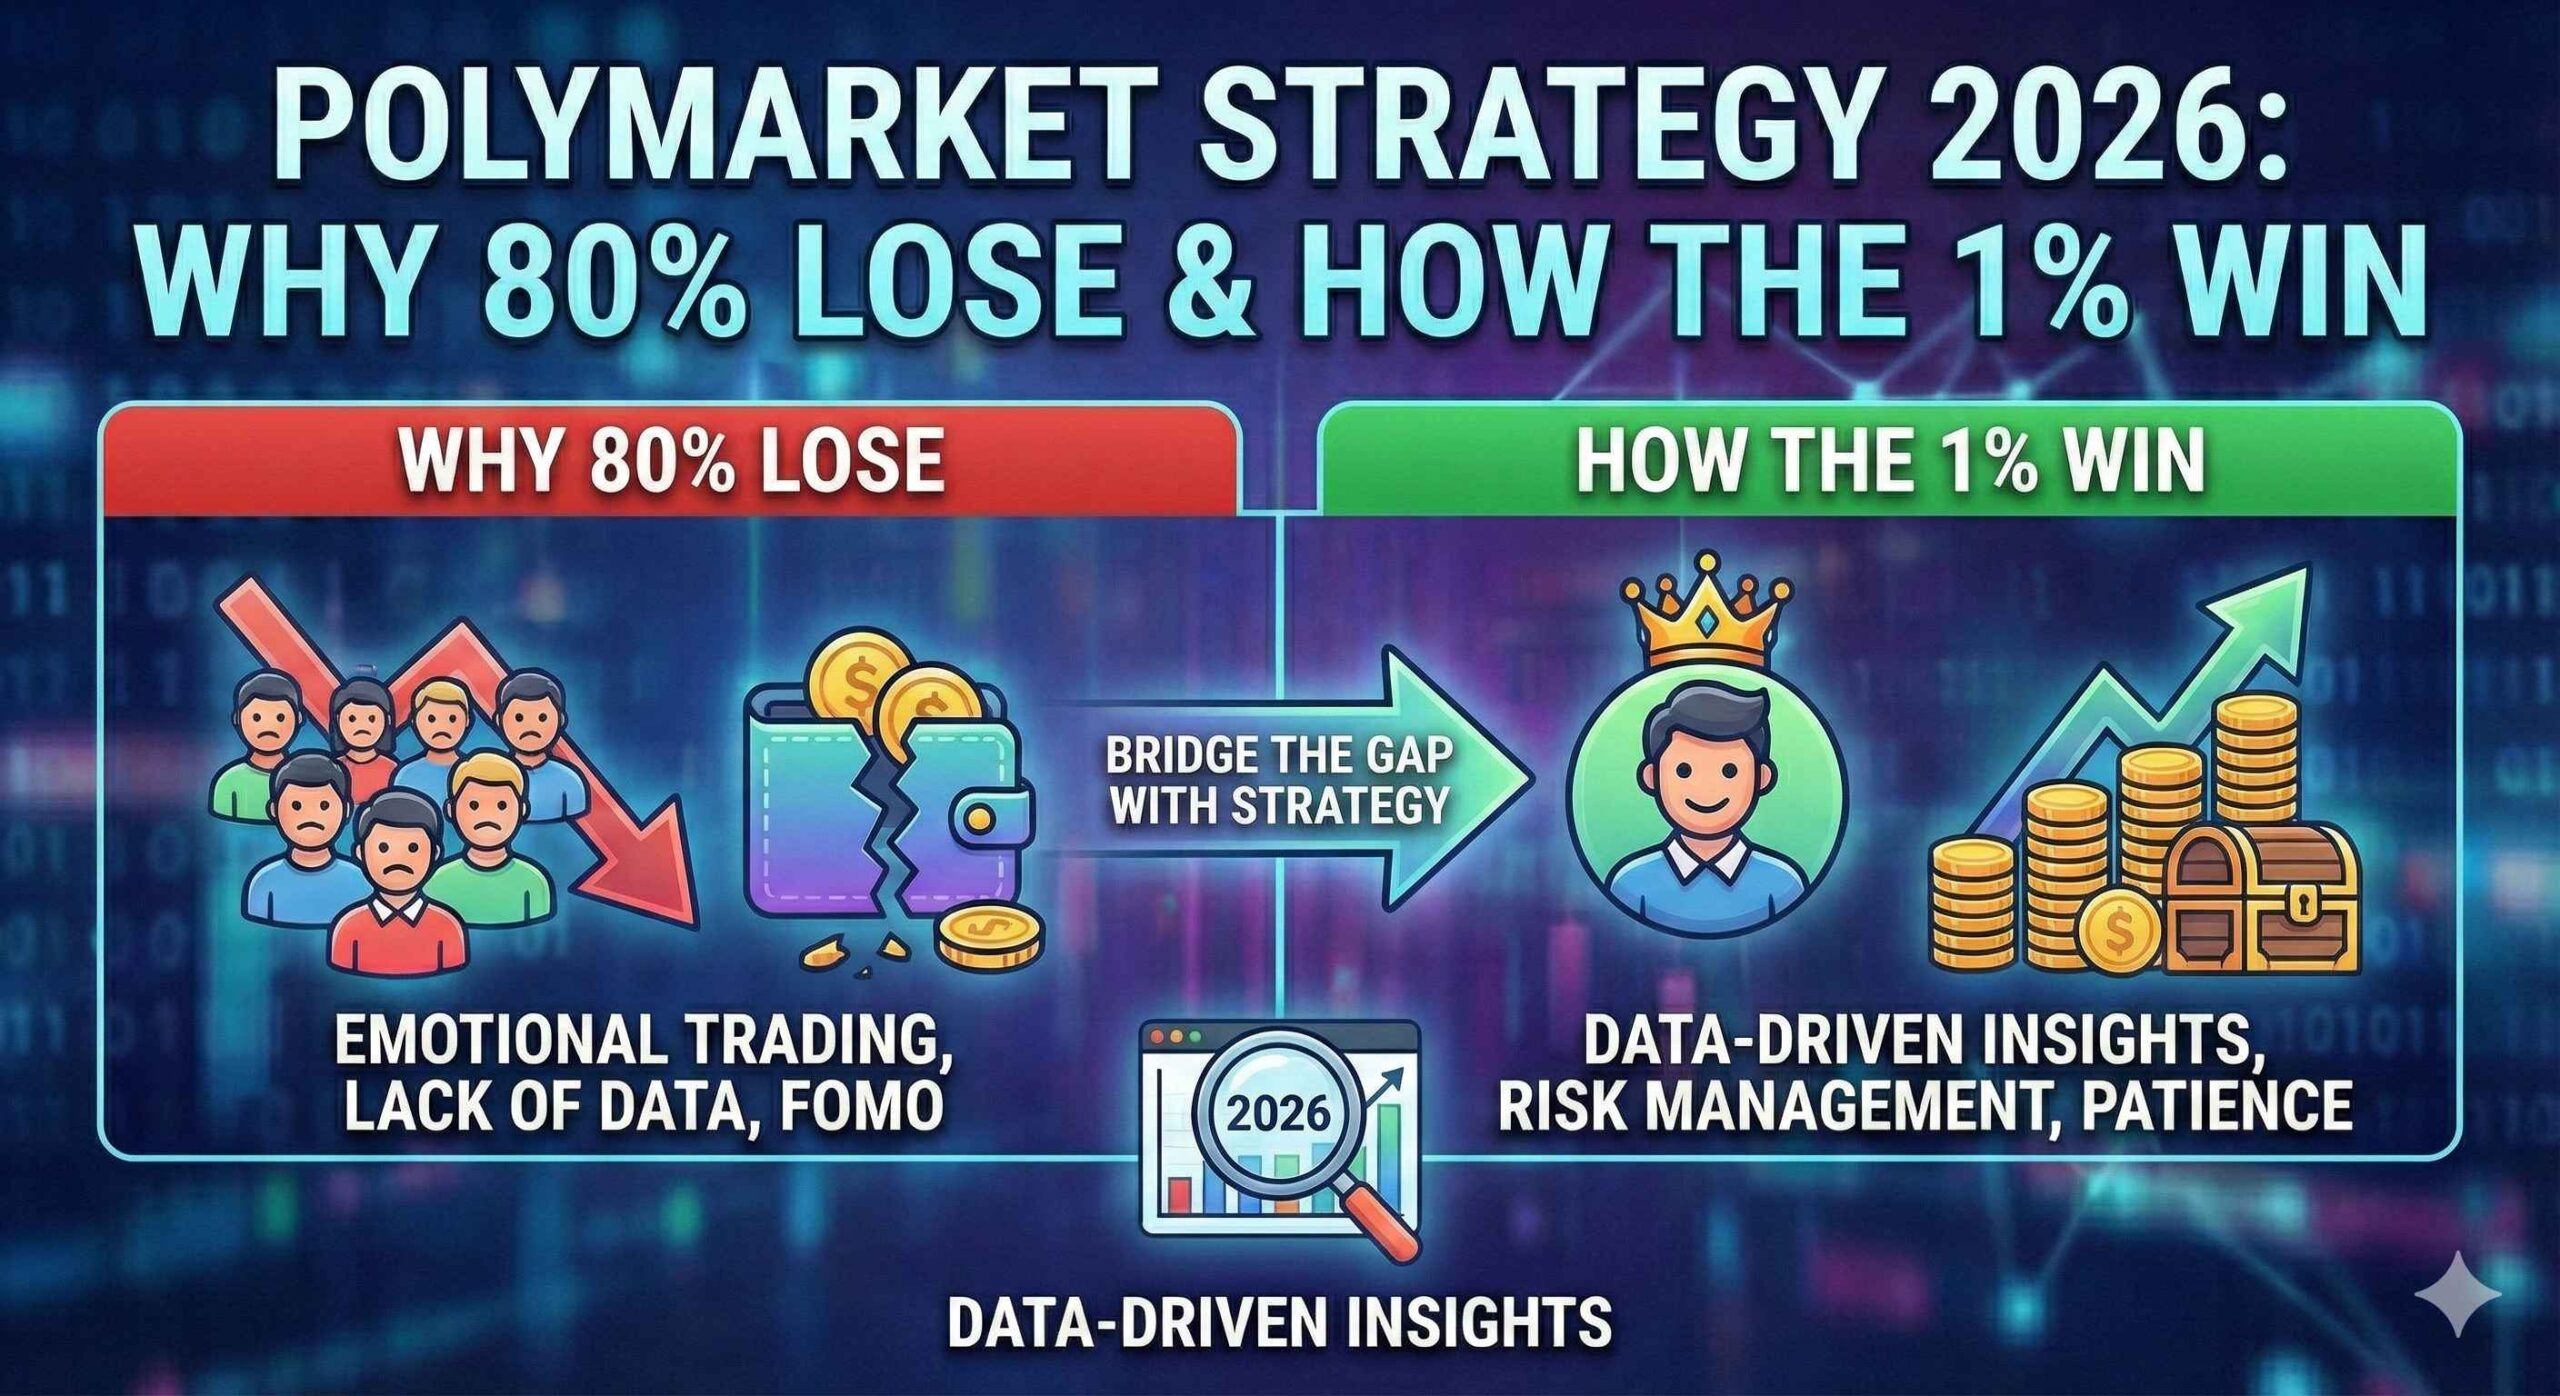
While traditional arbitrage opportunities still exist on Polymarket, the landscape has shifted dramatically in 2026. If you are looking for risk-free spreads, you are now competing against high-frequency bots.
This guide breaks down the three remaining arbitrage strategies and reveals the only one used by the top 1% of traders.
While you’re refreshing market pages hoping to catch a misprice, bots are executing trades in milliseconds and professional traders with institutional-grade polling data are taking your money.
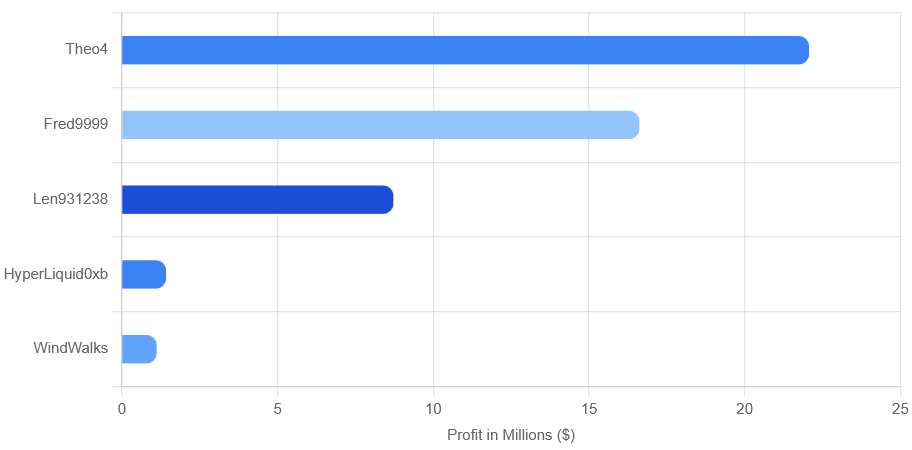
But here’s what most people don’t know, there’s a small group of traders, less than 1% of all participants, who are consistently banking six to seven figures annually on Polymarket. Theo4 made $22.05 million with an 88.9% win rate. Fredi9999 pulled in $16.6 million.
Len9311238 netted $8.7 million with a perfect 100% success rate. And no, they’re not lucky. They’re not insiders (mostly). They simply understand one fundamental truth that 99% of retail traders ignore
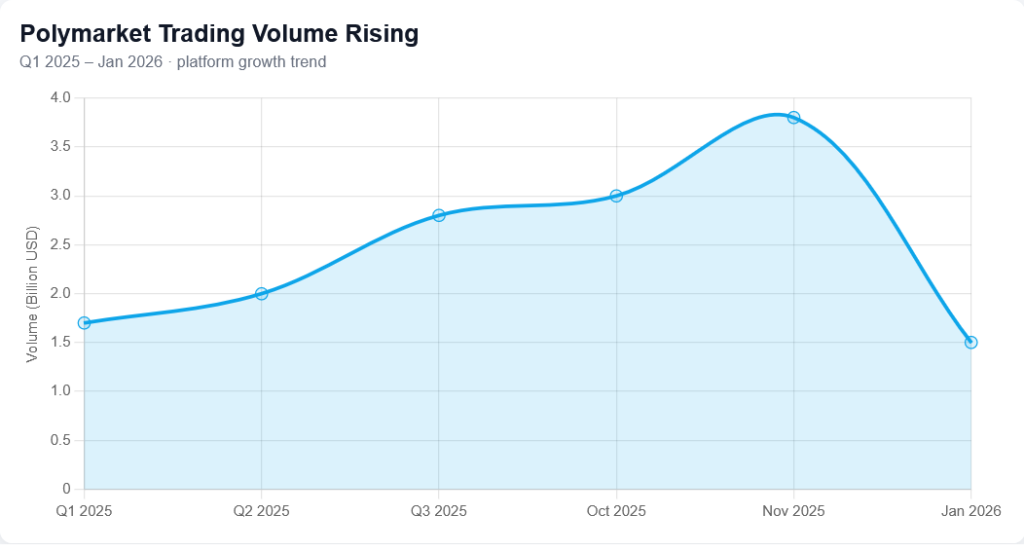
I analyzed Polymarket’s market behavior using data collected through the Polymarket public API, combined with structured market monitoring and independent datasets. This analysis was supported by reviewing and synthesizing publicly available research papers, trading reports, and previously published studies on prediction markets and on-chain trading behavior to track how Polymarket evolved from a niche platform into a multi-billion-dollar market infrastructure.completely.
The data tells a clear story, there’s exactly one strategy that works consistently in 2026, and it’s not what you think.
This isn’t a get-rich-quick scheme. It’s a systematic approach backed by cold, hard numbers.
And if you can execute it with discipline, the math says you can realistically target 35% to 95% annual returns depending on your skill level and risk tolerance.
Polymarket Strategy 2026: Why Arbitrage Is Dead & How the 1% Win
Polymarket has evolved. Liquidity is deeper, inefficiencies are smaller, and edge now comes from information, timing, and risk structure. Track live markets, odds movement, and real-time sentiment directly on Polymarket.
Disclosure: This link may be an affiliate link. If you use it, I may earn a commission at no extra cost to you.
Let’s break down exactly how this works.
Why Most Traders Are Bleeding Money Right Now?
Polymarket hit $21.5 billion in trading volume during 2025, with weekly volumes exceeding $1.5 billion by January 2026.
Those numbers look incredible until you realize that 80% of participants are net losers. The platform has fundamentally transformed, but most traders are still using 2023 playbooks in a 2026 market.
The 3 Types of Polymarket Arbitrage Strategies
Before diving into execution, you must understand which type of arbitrage you are targeting:
1. Cross-Platform Arbitrage (Polymarket vs. Kalshi)
This involves exploiting price differences between Polymarket and regulated exchanges like Kalshi. If “Yes” is 60¢ on one and 55¢ on the other, you buy the cheaper side.
2. Mechanical Arbitrage (Bots & Calculators)
This is the classic strategy of buying “Yes” and “No” when they sum to less than $1.00. Today, Polymarket arbitrage bots close these gaps in milliseconds, making manual execution nearly impossible.
3. Information Arbitrage (The ‘1%’ Strategy)
The most profitable strategy in 2026. Instead of looking for price errors, you look for probability errors using the framework below.
Why Basic Arbitrage Stopped Working?
Remember when everyone was talking about ‘risk-free’ arbitrage on Polymarket? Buy YES at 40 cents, buy NO at 50 cents, total cost 90 cents, guaranteed 10-cent profit at resolution?
That strategy generated $40 million in profits between April 2024 and April 2025. Past tense. This simple method no longer works for retail traders, but advanced arbitrage strategies do.
Here’s what happened, bid-ask spreads compressed from 4.5% in 2023 to just 1.2% in 2025. Professional market makers and algorithmic trading bots now dominate the order books. They detect and execute on mispricings in milliseconds, literally faster than you can click your mouse.
The top three arbitrage wallets combined made $4.2 million in a year, which sounds impressive until you calculate they probably had $500,000+ in working capital tied up.
For context, if you need $100,000 in capital to capture $10,000 in arbitrage profits over a year, you’ve made a 10% return.
You could’ve done better in a boring index fund without the execution risk, smart contract risk, and opportunity cost.
The Information Trap
The second way traders lose is by assuming they have an “edge” because they follow political news on Twitter or check injury reports before betting on sports.
A French trader famously made $85 million on the 2024 U.S. presidential election using proprietary polling methodology. Thousands of retail traders saw that story and thought, “I can do that too!”
They couldn’t. That trader had access to unique polling data and statistical models that correctly predicted outcomes while polls were still showing tight races.
Academic studies from 2025 confirmed that Polymarket’s prediction accuracy outperformed traditional polling aggregators, but only for traders with superior information.
If you’re getting your “edge” from public Twitter feeds and mainstream news sites, you’re not ahead of the market. You’re behind it.
The Wash Trading Problem
Here’s something most traders don’t even consider: up to 60% of Polymarket’s volume in December 2024 was wash trading, users making fake trades to inflate their activity for a potential token airdrop.
While this has stabilized to around 20% by late 2025, it creates massive noise in volume-based signals.
Markets that look liquid might actually be filled with artificial activity, leading to false confidence in position sizing.
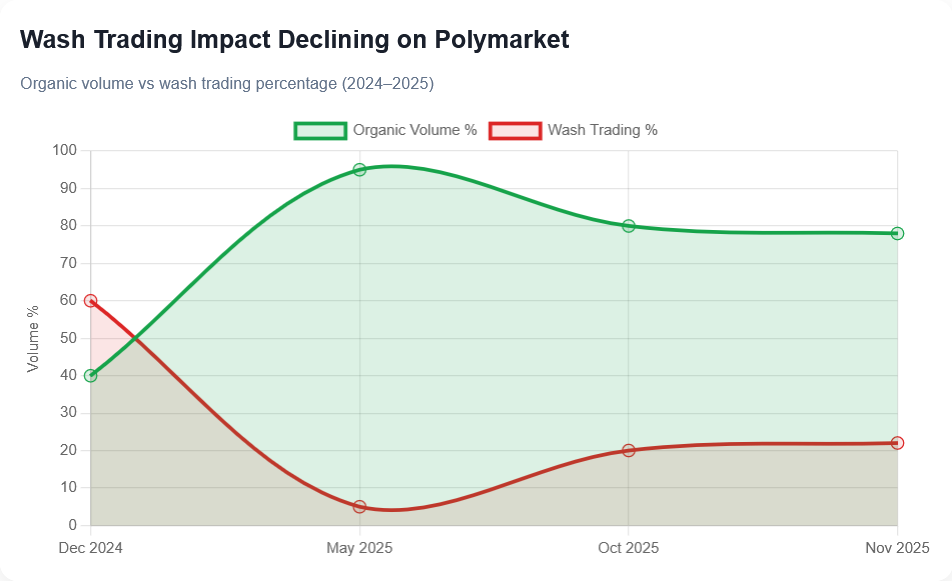
Columbia University researchers documented this phenomenon extensively, showing how reported volumes can be deceptive indicators of genuine market depth.
If you’re making trading decisions based on volume metrics without accounting for this structural noise, you’re essentially trading blind.
The Arbitrage Strategies That Work in 2026
After analyzing the performance data from top Polymarket traders, one pattern emerges with mathematical clarity, sustained profitability comes from domain expertise combined with disciplined position sizing, not from mechanical strategies or lucky hunches.
Let’s look at the numbers that prove this:
| Trader | Total Profit | Win Rate | Domain Focus | Trading Pattern |
|---|---|---|---|---|
| Theo4 | $22.05M | 88.9% | Mixed (Politics/Crypto) | Systematic, 100+ trades |
| Fredi9999 | $16.6M | 73.3% | Political Markets | Consistent polling analysis |
| Len9311238 | $8.7M | 100% | Specialized Niches | <10 high-conviction trades |
| HyperLiquid0xb | $1.4M | ~90% | Sports | Rapid news response |
| WindWalk3 | $1.1M+ | ~85% | Political (Concentrated) | Single massive wins |
Notice something crucial, profit doesn’t directly correlate with win rate. Len9311238 achieved a perfect 100% success rate but made less than Theo4’s 88.9% win rate.
Why? Because Theo4 made 100+ trades with systematic sizing, while Len9311238 likely made fewer than 10 extremely selective bets.
Both approaches work, but they require completely different skill sets and psychological profiles.
Why Domain Expertise Is Everything?
Polymarket’s market structure has bifurcated into two distinct ecosystems. Short-term markets (less than 24 hours) are disaster zones, 63.16% of these markets recorded zero trading volume.
They’re dominated by bots, scalpers, and retail gamblers with average holding periods measured in minutes.
Long-term markets (30+ days) tell a completely different story. They have 45 times greater liquidity than single-day markets. Political markets average $28.17 million in volume.
Major sports events carry $20-40 million. The bid-ask spreads are tight (1-2%), and order book depth allows positions from $10,000 to $500,000+ without causing significant slippage.
This creates the opportunity, medium-duration trades (3 to 30 days) in liquid markets where specific knowledge creates genuine advantage. You can’t out-execute bots in millisecond arbitrage.
But you can outperform the crowd by knowing which NFL quarterback is more likely to play through a questionable injury based on historical team behavior, or which Democratic primary candidate is gaining momentum in specific demographic segments that polls are underweighting.
The Information-Arbitrage Framework
“The winning arbitrage strategy in 2026 is what I call ‘information arbitrage’, systematically processing publicly available information faster, better, or more accurately than the market consensus. This is modern arbitrage: exploiting information gaps rather than price gaps.”
This isn’t insider trading. It’s building genuine analytical edges in domains where you can develop expertise.
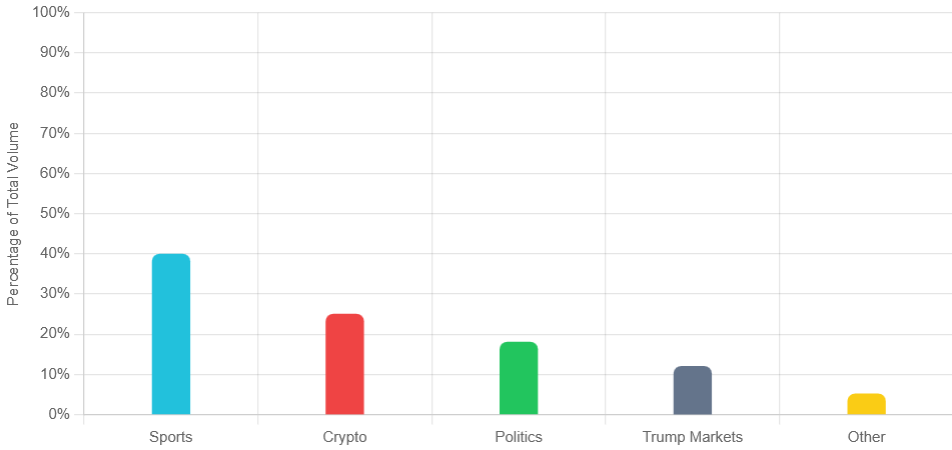
For sports markets (which represent 39.9% of Polymarket’s current volume), this means:
- Monitoring injury reports 4-6 hours before markets fully adjust
- Tracking weather conditions for outdoor games
- Analyzing historical team performance in specific situations
- Setting up automated alerts for breaking news
For political markets (18% of volume, plus another 12% in Trump-specific markets):
- Systematically analyzing polling data weighted by historical accuracy
- Tracking betting volumes across multiple platforms (Polymarket, Kalshi, PredictIt)
- Building statistical models that account for polling biases
- Identifying when markets overreact to recent events versus fundamentals
The key difference, this isn’t about “having an opinion.” It’s about having a systematic process that’s documentable, repeatable, and measurable.
Building Your Winning System Step-by-Step
Theory is worthless without execution. Here’s the exact framework that top traders use, broken down into actionable steps you can implement starting today, even if you are just learning how the platform works.
Step 1: Choose ONE Domain and Master It
The biggest mistake new traders make is trying to trade everything. Politics, sports, crypto, entertainment they scatter their attention and never develop real expertise in any category. Top performers specialize ruthlessly.
Your domain selection should be based on two factors:
- Information access: Where do you have or can you build a genuine information advantage?
- Market liquidity: Is there sufficient volume to enter and exit positions without massive slippage?
The most accessible domains for retail traders in 2026 are:
Sports Markets (Easiest entry for retail)
- Data is publicly available and updates frequently
- Market participants are often emotional/biased fans
- Edge comes from systematic analysis, not insider information
- Super Bowl 2026 alone has $627.3 million in volume
Political Markets (Harder but higher conviction)
- Requires statistical modeling of polling data
- Edge comes from better probability weighting
- High volume: Democratic Nominee 2028 at $389.6M, Presidential Election 2028 at $154.6M
Geopolitical Markets (Fastest growing)
- 29.7% active participation rate with explosive growth
- Less efficiently priced due to fewer expert participants
- Requires regional knowledge and language skills for optimal edge
Pick one. Build a 90-day track record with small positions ($100-500 per trade). Document your edge.
Only after proving consistent success should you increase position sizes or consider expanding to a second domain.
Step 2: Define Your Repeatable Edge
Your edge cannot be “I have a good feeling” or “I follow the news.” It must be systematic, documentable, and repeatable. Here’s what that looks like in practice:
If trading sports:
- Set up RSS feeds or alerts for injury reports from beat reporters
- Create a spreadsheet tracking team performance in specific weather conditions
- Document historical coach decision-making patterns (do they rest starters when locked into playoff position?)
- Build a simple model: Team X wins 73% when Condition Y is true, market is pricing 58%, that’s your edge
📊 “Information Arbitrage” (EV) Finder
Is the market wrong? Enter the current price and your estimated probability to calculate the Expected Value (EV) of the trade.
Use our Polymarket Arbitrage Calculator to analyze whether market pricing offers positive expected value compared to your probability estimates.
If trading politics:
- Aggregate polling data from 8-10 sources daily
- Weight each poll by sample size, historical accuracy, and recency
- Compare your probability model to Polymarket’s pricing
- Enter when gap exceeds 8-12 percentage points
If trading geopolitics:
- Follow regional news sources in native languages
- Understand resolution criteria precisely (what exactly qualifies as “military intervention”?)
- Track social media sentiment using tools like Twitter’s Advanced Search
- Identify when Western media narratives diverge from on-ground reality
The test could you explain your edge to someone else in 3 sentences? Could they replicate your process? If not, you don’t have a systematic edge, you have a hunch.
Step 3: Position Sizing Using Fractional Kelly
🧮 Polymarket Arbitrage Calculator & Position Sizing
Calculate optimal bet size using the Kelly Criterion.
This is where most traders, even those with genuine edges, destroy themselves. They correctly identify a favorable trade, then bet 30-40% of their bankroll on it.
One or two losing streaks later, they're psychologically broken and financially crippled.
The Kelly Criterion provides the mathematical framework for optimal position sizing.
The formula: Position Size = (Win Probability × Profit Ratio - Loss Probability) / Profit Ratio
For Polymarket's typical 1:1 payout structure with a 70% win rate:
- Full Kelly: 40% of bankroll per trade
- Half Kelly: 20% of bankroll
- Quarter Kelly: 10% of bankroll (recommended for prediction markets)
Why quarter Kelly? Because prediction markets have higher uncertainty than the math suggests. A study of top traders found they typically risk 5-15% of bankroll per trade.
Quarter Kelly creates a maximum drawdown probability of just 4% (chance of losing half your bankroll), compared to 33% with full Kelly.
Practical example on $100,000 bankroll:
- Conservative approach: $5,000-10,000 per trade
- Aggressive approach: $10,000-15,000 per trade
- Never exceed: $20,000 per single trade
On a $10,000 bankroll:
- Conservative: $500-1,000 per trade
- Aggressive: $1,000-1,500 per trade
- Never exceed: $2,000 per single trade
Step 4: Entry and Exit Rules (Non-Negotiable)
Discipline separates winners from losers. Your rules must be predetermined and followed mechanically:
Entry checklist:
- Your edge (probability advantage) exceeds 8-12 percentage points over market pricing
- Order book depth shows $10,000+ on your favorable side
- Market has been active for 5+ hours (reduces noise from initial price discovery)
- You're not entering on a news spike (wait 2-4 hours for emotional overreactions to fade)
Exit checklist:
- Take profits at 60-70% of theoretical maximum, not at 100% resolution.
- Cut losses at -40% of position size (if you bought at 55 cents and price drops to 45 cents, you've lost 10 cents on a 55-cent bet exit)
- If your probability edge shrinks to less than 3 points, exit 50% of position immediately
- Place limit sell orders when entering trades (removes emotional decision-making)
The 2026 Market Calendar: Where the Money Flows?
Strategic timing multiplies your edge. Polymarket volume isn't random, it concentrates around predictable events. Position yourself ahead of these volume surges.
February 2026: Super Bowl LIX
- Total volume: $627.3 million (highest on platform)
- Volume pattern: Concentrates in final 48 hours (15x daily average)
- Optimal entry window: Weeks 1-2 when spreads are 3-4% wide
- Optimal exit window: Days 5-7 before volume compresses spreads
- Edge source: Injury reports 3-7 days before game when markets are slow to adjust
Q1-Q2 2026: NCAA March Madness & NBA Playoffs
- Combined volume: $150-200 million estimated
- Edge opportunities: Upset potential, coaching matchups, player health
- Market inefficiency: Retail bias toward popular teams creates value on underdogs
Ongoing: 2028 Election Markets
- Democratic Nominee 2028: $389.6 million volume
- Presidential Election 2028: $154.6 million volume
- Long-duration advantage: 45x greater liquidity than short-term markets
- Entry timing: After primary elections when frontrunner becomes clear
- Edge source: Polling aggregation and historical modeling
Q2-Q4 2026: International Sports
- UEFA Champions League: $144.5 million
- English Premier League: $139.4 million
- 2026 FIFA World Cup (June-July): Expected $300-500 million
- Edge opportunities: Time zone advantages for regional knowledge, lineup announcements
Wildcard: Geopolitical Events
- Average volume per major event: $25-50 million
- 29.7% participation rate (fastest-growing category)
- Examples: Venezuela political transitions, Middle East conflicts, European elections
- Edge source: Regional expertise and resolution criteria analysis
Risk Management

Let's talk about what happens when you're wrong. Because you will be wrong, repeatedly. Even traders with 80-90% win rates lose 10-20% of their trades.
The difference between professionals and amateurs isn't win rate. It's what happens during the losing streaks.
The Psychological Reality
Polymarket shows your position value in real-time. A $5,000 position can swing 20% in an hour based on a single tweet or breaking news alert.
This creates overwhelming temptation to "wait it out" when you're down, hoping for recovery. Professional traders overcome this through automation and pre-commitment.
Implementation tactics:
- Place limit sell orders immediately when entering positions (50% at +15%, 30% at +25%, 20% at +40%)
- Use Polymarket's API to monitor positions automatically, set alerts for 3+ point moves against you
- Keep a spreadsheet of rules for each domain you trade
Oracle Disputes Are Real Money Risks
Polymarket has experienced multiple high-stakes resolution disputes:
- $10.5 million locked in Venezuela "invasion" market due to definition ambiguity
- Multiple RFK Jr. markets with resolution confusion
- Google "Year in Search" market with suspected insider trading
Your protection:
- Read resolution criteria before entering every trade
- If language is ambiguous, assume 10-15% risk of unfavorable resolution
- Exit at 70-75% of maximum profit, not 100% (leaves margin for disputes)
- Avoid markets where government officials have financial incentive to influence outcomes
Drawdown Recovery Math
Using quarter Kelly position sizing, even a 50% bankroll drawdown is recoverable:
- $100,000 to $50,000: Takes 10-12 negative months (statistically unlikely but possible)
- $50,000 to $75,000 recovery: 4-5 positive months
- $75,000 to $100,000 recovery: 4-5 more positive months
- Total recovery time: 18-22 months
This is painful but survivable. Traders using full Kelly face 3+ years to recover from similar drawdowns, most quit before recovery.
What 2026 Success Actually Looks Like?
Let me give you realistic expectations based on actual trader data and mathematical modeling.
Conservative scenario (70% win rate, $100,000 bankroll):
- 8 trades per month (2 per week)
- Average position: $1,000 (1% per trade using quarter Kelly)
- Results: 5.6 winners at +$650 average, 2.4 losers at -$300 average
- Monthly profit: $2,920
- Annual return: 35% or $35,000
- Drawdown risk: 4% chance of 50% loss
Aggressive scenario (80% win rate, $100,000 bankroll):
- 10 trades per month
- Average position: $1,500 (1.5% per trade)
- Results: 8 winners at +$1,125 average, 2 losers at -$525 average
- Monthly profit: $7,950
- Annual return: 95% or $95,000
- Drawdown risk: 11% chance of 50% loss
These projections assume you can maintain the stated win rate (requires genuine edge), execute disciplined exits (psychologically difficult), and trade in liquid markets (not always available).
The average Polymarket trader achieves a 45-50% win rate and loses 15% annually.
The 1% who sustain 70%+ win rates all have one thing in common: institutional-quality edge in their chosen domain.
Your Next Move
Here's what separates theoretical knowledge from actual profit: execution. Thousands of traders will read about Kelly criterion and information arbitrage.
Maybe 100 will actually implement it. Perhaps 10 will stick with it through their first losing streak.
Start small. Pick one domain, probably sports if you're new to prediction markets. Make 20 trades at $100-500 each.
Document every trade, your edge thesis, entry price, exit price, result. Calculate your actual win rate and average profit/loss after 20 trades.
If your win rate is below 60%, your edge isn't real yet. Study more, trade smaller, refine your process. If you're hitting 65-75%, gradually increase position sizes following quarter Kelly.
If you're above 80%, you either have an exceptional edge or a statistically lucky streak, keep documenting to find out which.
The math works. A $100,000 bankroll with a legitimate 70% edge generates $35,000 annually with manageable risk.
A $500,000 bankroll with 80% edge generates $475,000 annually. But you cannot fake the edge, skip the discipline, or ignore the position sizing.
Polymarket is no longer a retail playground where anyone can stumble into profits. It's an institutional market with $9 billion backing and sophisticated participants.
But that doesn't mean retail traders can't compete, it means you must compete with professional-grade systems.
Build genuine domain expertise in one category. Define systematic, repeatable edges. Size positions using fractional Kelly.
Execute mechanically without emotion. That's the strategy. It's not sexy. It's not easy. But it's the only one that consistently works in 2026.
Everything else is just gambling with extra steps.
Methodology
This research is based on original analysis of Polymarket trading behavior, historical volume trends, top trader performance, and market structure changes observed between 2024 and early 2026. The goal of this study was to understand how profitability dynamics are shifting on Polymarket and why traditional arbitrage strategies are rapidly losing effectiveness.
Data was collected using a combination of the Polymarket public API, structured market scraping, and independent datasets generated through Perplexity-powered research workflows. This includes market volume history, category dominance, order book behavior, wash trading indicators, top market volumes, and wallet-level performance snapshots.
In addition to raw platform data, this research incorporates insights from publicly available trading reports, on-chain activity studies, and previously published analyses on prediction markets, election markets, sports markets, and crypto-based forecasting platforms. These external publications were used to validate trends, compare growth patterns, and contextualize Polymarket’s evolution within the broader prediction market ecosystem.
Quantitative analysis focused on volume flows, win rate distributions, liquidity concentration, category rotation, market efficiency changes, and the long-term decline of low-skill arbitrage opportunities. Qualitative analysis examined how institutional participation, algorithmic traders, and crowd behavior are reshaping market edges.
All conclusions in this article are derived from observed data patterns, repeated market behavior, and comparative historical analysis rather than isolated trades or short-term outcomes. This methodology was designed to highlight structural shifts in Polymarket rather than promote speculative tactics.
