

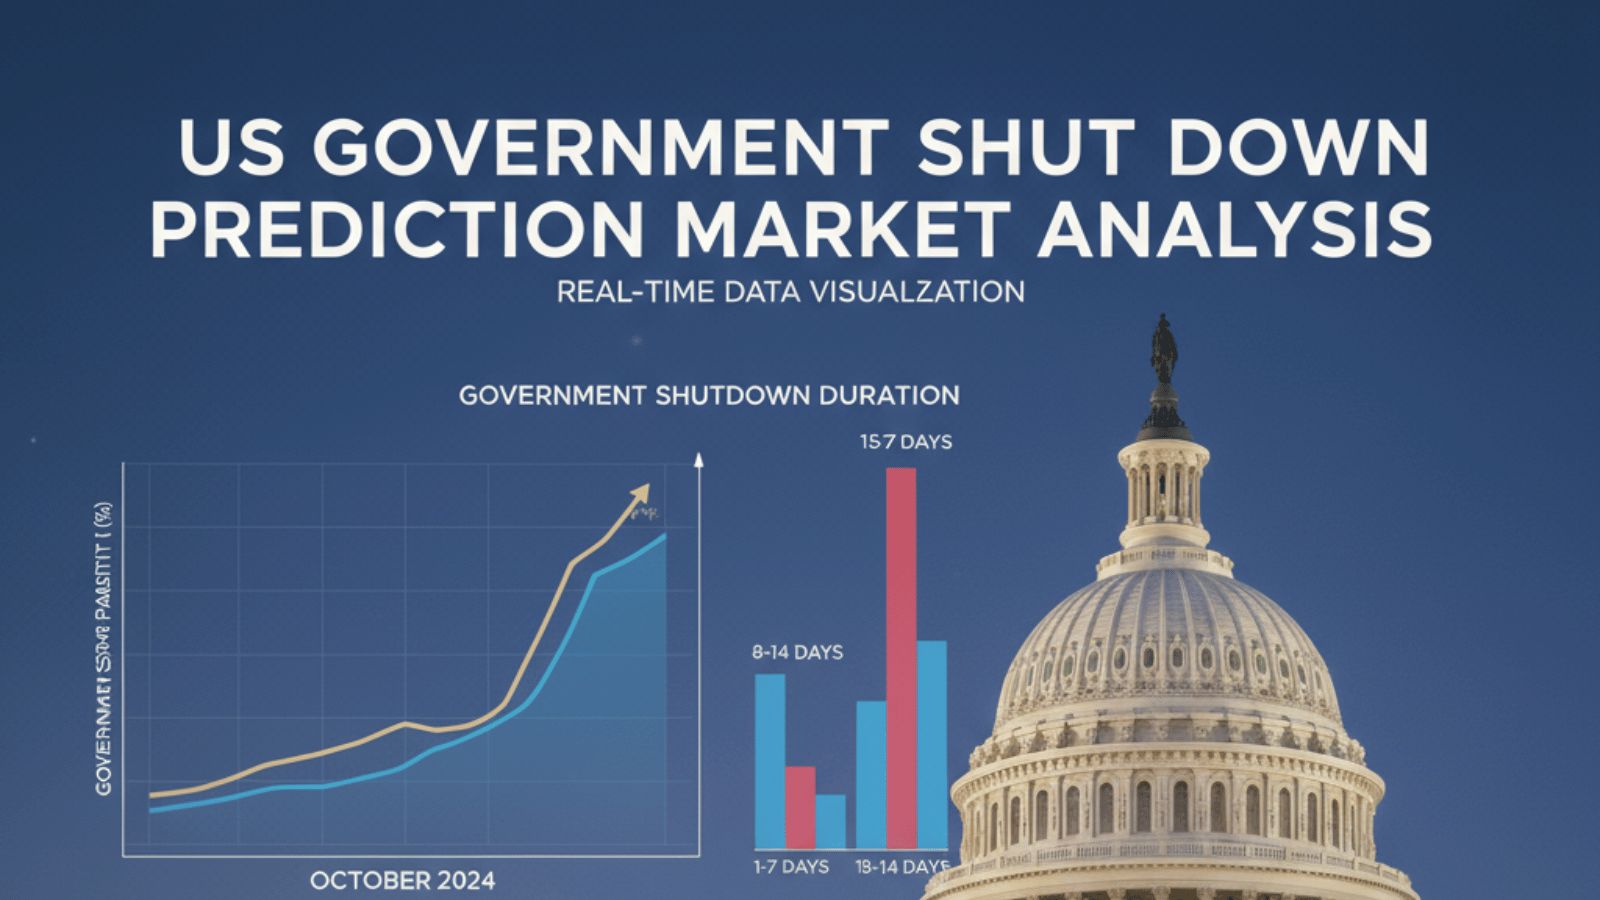
The ongoing U.S. government shutdown has created uncertainty in both political and financial circles. Prediction markets such as Polymarket offer a real-time, crowdsourced method to gauge consensus probabilities regarding when the shutdown might end.
Here’s how to interpret this market, what the stats mean, and strategic steps you can take as a participant or analyst.
Polymarket traders have bet close to $4.9 million on the likely end date of the current shutdown, making this a must-watch market for analysts, speculators, and concerned citizens alike.
If you’re serious about understanding the odds, making sharper predictions, or maximizing your returns, Polymarket’s shutdown market is where the action is. Let’s break down the latest numbers, dig into the crowd’s sentiment, and figure out your smartest moves.
Market Breakdown
- Total Volume: The market has attracted over $8.12 million in trading volume as of November 6, 2025.
- Resolution Criteria: The market resolves according to the date (ET) the U.S. Office of Personnel Management (OPM) formally announces the end of the shutdown, not necessarily the reopening date.
- End Date: Nov 15, 2025. If unresolved, bets return or market closes.
Latest Probabilities – Where’s The Money Going?
The current shutdown market splits bets into distinct date “buckets.” As of the latest update, here’s how traders are pricing the chances of various scenarios:
| Date Range | Chance (%) | Volume ($) |
|---|---|---|
| Nov 16+ (Nov 16 & later) | 47% | 695,969 |
| Nov 8-11 | 17% | 150,620 |
| Nov 12-15 | 17% | 141,573 |
| Nov 4-7 | 16% | 257,837 |
| Oct 31-Nov 3 | 1% | 695,157 |
Wall Street isn’t buying into an immediate solution. Nearly half the volume bets on the mess extending beyond November 16.
Earlier dates (this week or next) are long shots, with only a few contrarians hoping for an overnight miracle. The majority of traders currently believe the shutdown will last until at least November 16, with nearly half the market backing this outcome.
How Long Are US Shutdowns? Historical Perspective
See below for the historical length of major shutdowns, including the current 2025 showdown, now the second longest in history.
US Government Shutdowns: Length by Year (1976-2025)
US Gov Shutdowns Since 1981
Largest US Shutdowns Since 1980
If we look back over the last four decades, US government shutdowns have spanned from quick standoffs, just a couple of days to protracted, high-stakes battles that drag on for weeks. Each of these major shutdowns tells a story about the political climate of its time, and about the issues that deepened divisions in Washington.
| Year | Duration (Days) | President | Reason/Context |
|---|---|---|---|
| 2018-19 | 35 | Trump | Funding for border wall |
| 1995-96 | 21 | Clinton | Budget disputes, Medicare |
| 2013 | 16 | Obama | Affordable Care Act funding |
| 1990 | 3 | Bush Sr. | Budget deficit, taxes |
| 1981-86 | 2-3 each | Reagan | Spending bills gap |
Current (2025): Approaching 30+ days, and may well set a new record.
This shutdown set a stunning record for length, driven by an impasse between President Trump and Congress over funding for a border wall. It lasted over a month, causing massive disruption: hundreds of thousands of federal employees went without pay, vital services were paused, and food assistance was delayed for millions.
The protracted nature of this shutdown showcased just how high-stakes partisan battles can get when both sides decide to dig in their heels.
Clinton Era Clash (1995-96, 21 Days):
During President Clinton’s term, budget fights over Medicare and government spending led to a three-week shutdown. While shorter than Trump’s record, this standoff signaled an era of sharpened partisan conflict over healthcare and fiscal priorities, themes that would return again and again throughout the following decades.
2013 Affordable Care Act Funding Showdown:
President Obama’s 16-day shutdown emerged from clashes over funding the ACA (“Obamacare”). While not as long, it reflected the deep divisions on health policy, issues that continue to be politically explosive and can quickly gridlock negotiations.
Earlier Shutdowns (Bush Sr. & Reagan):
Shorter disputes, often just a few days, were common in the 1980s and early 1990s. These episodes, mostly over budget gaps or deficits, typically resolved faster, owing to less polarization, fewer “red line” demands, and different negotiation dynamics in Congress.
What Does This Mean for 2025?
The fact that the current shutdown is now past 30 days and possibly heading for a new record tells us something crucial:
- Partisanship is at an all-time high: Modern shutdowns are lasting longer because compromise is harder to achieve in today’s Congress.
- Issues at stake are bigger: Healthcare, immigration, economic recovery, and election-year pressures create “all or nothing” conflicts.
- Consequences snowball: The longer the shutdown, the more severe its economic and social impact in public anxiety, delayed payments, disrupted services, and ripple effects across markets.
For prediction market analysts and speculators
History shows that as a shutdown passes the two-week mark, odds increasingly tilt toward a longer standoff. The crowd’s near-even split in Polymarket for mid-November and later is rooted in this reality: once gridlock persists beyond the initial rounds of negotiation, entrenched sides make rapid resolution less likely.
So, when betting on outcomes or interpreting market sentiment, it’s wise to factor in these historical durations and the underlying context, most shutdowns lasting more than two weeks have required major political maneuvers, public pressure, or dramatic new concessions to finally break the deadlock.
Key Takeaway: Shutdown duration is more than a statistic, it measures the depth of political impasse and the difficulty of consensus. Use this historical lens to sharpen your own prediction, strategy, and understanding as the 2025 shutdown story continues.
Shutdown By The Numbers, Impact & Economic Cost
Congressional Deadlock
- 13 failed Senate votes to end the 2025 shutdown in 31 days.
- Only 55 Senators (out of 100) supported reopening, 5 short of the filibuster-proof 60.
SNAP & Food Insecurity
- 42 million Americans receive SNAP (food stamps); benefits paused as of Nov 1.
- Cost to fund November’s stamps: $9.2 billion. Only $5 billion in contingency reserves remain.
- Federal SNAP spending (2024): $99.8 billion.
Federal Workforce
- 670,000 federal employees furloughed (sent home unpaid).
- 730,000 “essential” federal employees working without pay.
- 4,000 layoff notices sent out to workers in 7 agencies.
| Agency | Shutdown Layoffs |
|---|---|
| Treasury Department | 1,446 |
| Health & Human Services | 1,100–1,200 |
| Education | 466 |
| Housing & Urban Development | 442 |
| Commerce | 315 |
| Energy | 187 |
| Homeland Security | 176 |
Economic & Social Cost
- $7 billion estimated permanent GDP loss after four weeks.
- $11 billion after six weeks, $14 billion if eight weeks.
- Each day, federal workers lose about $400 million in pay.
- $130 million donated just to cover troops’ pay for one cycle (from private sources).
Shutdowns in Historical Perspective – What Usually Resolves A Standoff?
Most shutdowns end when Congress passes a “continuing resolution” (short-term funding), after which negotiations resume for a long-term deal.
Key historical facts:
- 20 funding gaps since 1976 have led to 10 actual shutdowns.
- Shutdowns have grown longer and more frequent since the 1990s as political polarization increases.
- Every recent shutdown resolved by short-term funding, then budgeting negotiations milestone deals often come after missed paychecks or media pressure.
What Is Probability Drift in Prediction Markets?
In a highly dynamic event like the government shutdown, Polymarket’s odds rarely stay still. Probability drift refers to the gradual, directional movement of market odds as traders collectively update their beliefs. Instead of sudden jumps, you often see probabilities for particular date ranges (such as “November 16+”) slowly increase or decrease as new information trickles in. This drift is shaped by:
- Incremental news: Legislative negotiations, leaks, or minor procedural updates gradually influence trader opinion.
- Market consensus shifts: As more traders lean in one direction, say, toward a longer shutdown the cumulative effect nudges odds that way over days or weeks.
- Recency bias: Recent failed votes or missed compromise deadlines add weight to the likelihood of extended gridlock, moving probabilities more for “late” buckets, even absent major headlines.
How Do You Measure Volatility in Prediction Markets?
To quantify just how reactive (or volatile) a market is, analysts use a volatility index. This index is calculated as the standard deviation of probability changes over a certain time period, here, the past five days.
High volatility signals a market that’s highly sensitive to new information, with bigger swings in probabilities; low volatility, by contrast, means the crowd’s belief is relatively stable.
Current Snapshot:
- Shutdown Market Volatility (Last 5 Days): 0.19
- Comparable Election Market Volatility: 0.08
In other words, the shutdown market’s volatility is nearly 2.3 times higher than that of typical political markets like elections.
Why Is Shutdown Market So Volatile Right Now?
Elevated volatility in the shutdown market points to intense uncertainty and frequent new developments.
Unlike a scheduled event (like an election date), shutdown prognosis can shift at any moment after each congressional vote, leadership speech, or behind-closed-doors negotiation leak. This creates:
- Thin margins for consensus: Every failed amendment or breakdown in talks strengthens the long-term (late resolution) buckets while making short-term solutions look less likely.
- Whiplash reactions: Traders may reallocate funds quickly, piling into “late” buckets after missed deadlines, or briefly favoring earlier dates when optimistic rumors surface, only to retreat if negotiations collapse again.
Practical Takeaway: Trading Amid High Volatility
- Expect frequent probability swings: Even without major headlines, cumulative legislative delays drive a “probability drift” upward for longer-duration outcomes. Don’t anchor too heavily to early optimism; be ready to adjust quickly.
- Watch for volatility spikes: Sudden jumps in the volatility index often correspond with breaking news use them as signals of potential turning points.
- Risk management: With volatility this high, avoid “all-in” bets on narrow date ranges. Diversifying positions is smart, and so is taking profits after large probability moves rather than chasing every headline.
Polymarket’s probability drift and heightened volatility highlight how closely this market tracks the unpredictable chaos of real-world politics.
Savvy traders not only follow the news but use these technical signals as cues to time entries and exits, recalibrate risk, and spot when crowd sentiment is truly shifting, not just making noise.
Buzz on X: Sentiment and Key Themes [UPDATED]
X (formerly Twitter) is abuzz with this market, blending frustration over the shutdown’s real-world impacts (e.g., flight delays, furloughed workers) with speculative betting chatter.
As the U.S. government shutdown enters its 32nd day on November 2, 2025, Polymarket’s market reflects deepening pessimism with $5M in trading volume. Odds now favor a November 16+ end at 48%, up from 43% last week, implying a median resolution around November 28 potentially a record 58 days.
Earlier windows hold low: Nov 4-7 at 17%, Nov 8-11 at 18%, Nov 12-15 at 18%, and Oct 31-Nov 3 at 1%. This skew, with $711K volume on the long-tail bet yielding ~108% returns per $100, underscores trader bets on gridlock amid CBO’s $7-14B irrecoverable GDP hit for a six-to-eight-week drag.
X buzz has spiked 30% week-over-week, fusing bets with shutdown woes like furloughs and delays. IncomeSharks‘ Oct 31 post on Nov 4-7 odds jumping to 17% drew 190 likes and 36K views, cautioning markets may react past day 35.
High-virality OSINT account (694 likes, 196K+ views) ties Polymarket’s 45%+ odds to House Speaker Johnson’s stance, adding political context to trader pessimism.
High-engagement finance account (214 likes, 27K views) notes Polymarket’s Nov 27 prediction as record-breaking, with a humorous stock market twist, great for market sentiment contrast.
Official US prediction market account (affiliated with Polymarket, 50K+ followers) gives a direct 54% chance for end by Nov 15—balances the pessimism with a concise stat (12 views, but authoritative).
Polymarket Data – How Should You Respond?
Polymarket odds represent deeply pessimistic sentiment: high chance of gridlock, low faith in compromise. Large volumes in longer-term date buckets serve both as conviction and risk-hedging.
Strategy Tips
- Don’t Just Follow the Crowd: Analyze your own sources, if talks appear more hopeful than the crowd believes, consider moderate bets on earlier closure.
- Diversify Positions: Spread bets across several date ranges to avoid being caught out by surprise developments or shifting news cycles.
- Watch for Volume Shifts: Large new bets can move the market, monitor why traders are suddenly piling into a bucket.
- Contrarian Play: Low-probability dates offer high rewards, especially if you spot an overlooked news development or political compromise.
- History as Guide: Use data on past shutdown durations to temper your expectations, resolution often takes longer than optimistic forecasts.
- Monitor OPM Announcements: Market resolution is based only on official declaration, not on rumors of reopening.
Final Outlook, Markets & History Point to Caution
If history, data, and market behavior hold true, the most likely outcome is that the U.S. government shutdown will end between November 20–28, 2025, after a temporary funding deal pushing total duration close to 60 days, the longest in American history.
Polymarket odds currently reflect that expectation, pricing late November as the dominant outcome. For traders, this is both a warning and an opportunity: late bets may carry smaller returns, but they remain the statistically sound side of history.
In prediction markets, timing is everything. The crowd may be right about the direction that gridlock continues but it will almost certainly misprice the turning point.
That turning point is what separates a sharp analyst from the average speculator.
Combine market odds with real news and political analysis, diversify your positions, and use data to make the smartest, risk-adjusted bets possible. Don’t let the crowd think for you let history guide your expectations and remember: resolution rule is everything.
