2026 Midterm Election Predictions:
What Markets Are Saying?
Real-money prediction markets consistently outperform traditional polls. Track live Polymarket & Kalshi odds on House, Senate, and Balance of Power for the 2026 US Midterm Elections.
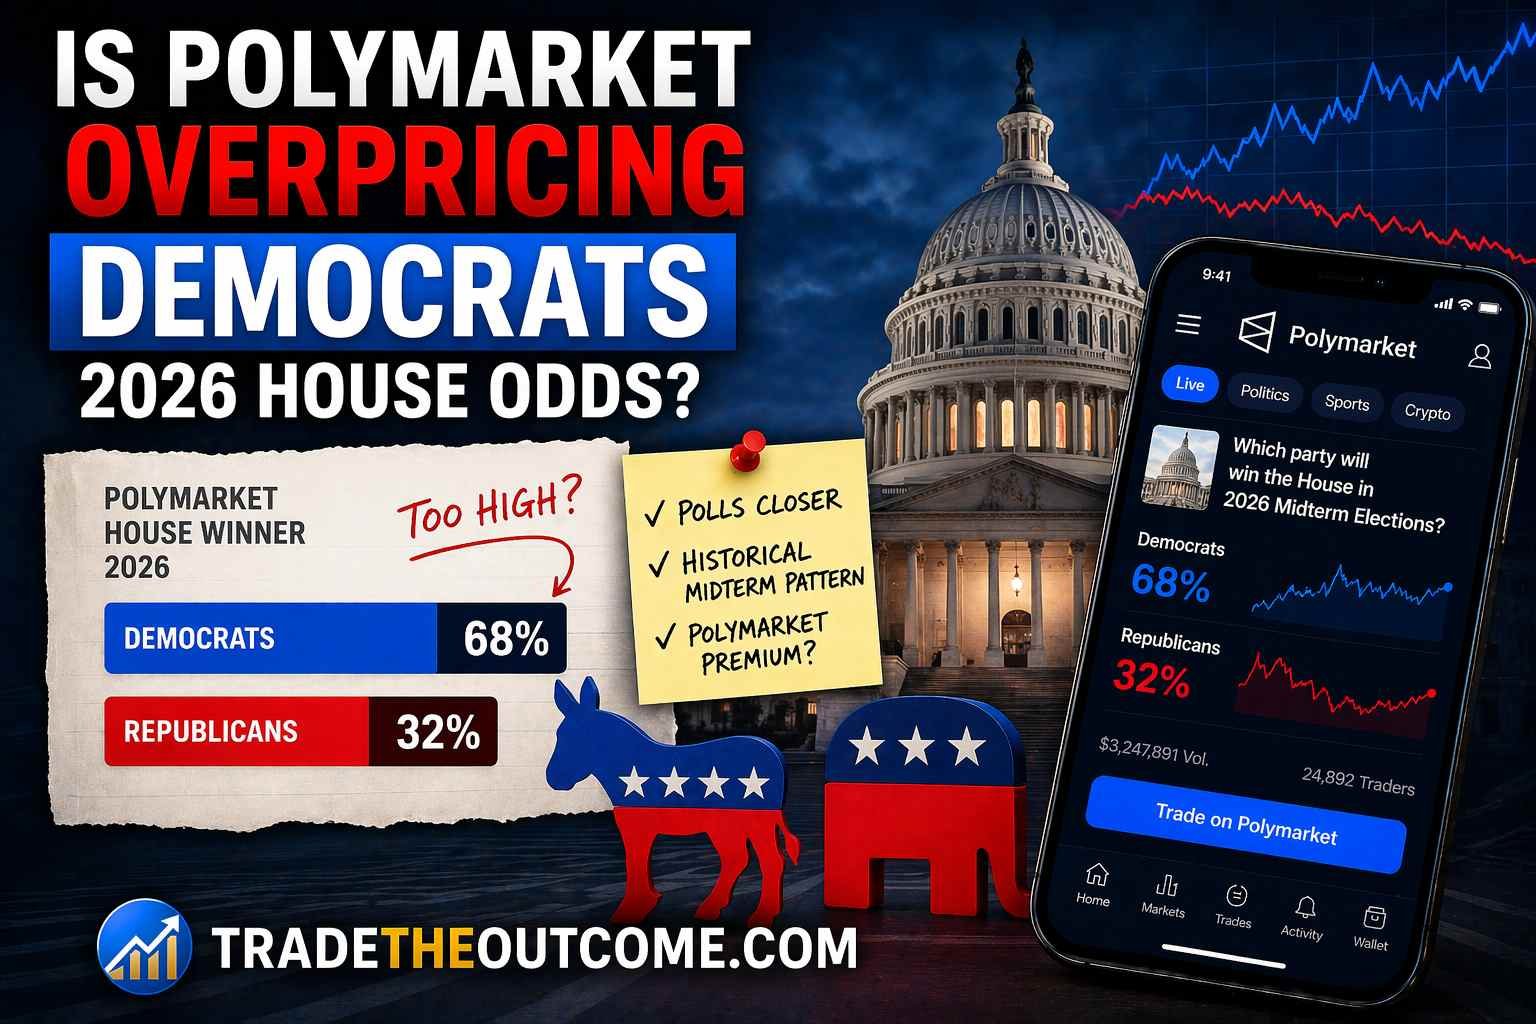
Prediction markets consistently outperform traditional polls. Traders put real money behind their forecasts on Polymarket, currently pricing in a Democratic-favored outcome for both the House and Senate in the 2026 midterm elections. The live odds below update automatically every hour.
What Are Prediction Markets?
Prediction markets are platforms where real people bet real money on the outcome of future events. Unlike political polls that ask what people think, prediction markets reveal what people believe enough to bet on. The financial incentive forces accuracy, a trader who bets based on wishful thinking simply loses money.
Polymarket is the world’s largest prediction market, with tens of millions of dollars traded on the 2026 midterm elections. When the odds show Democrats at 85%, it means traders collectively place an 85% probability on Democrats winning, and they are backing that view with real capital.
Key fact: Academic research finds prediction markets outperform traditional polling in election forecasting accuracy in over 74% of studied elections. The mechanism is simple — money creates accountability that opinion surveys lack.
Why the 2026 Midterms Matter?
The 2026 midterm elections, held on November 3, 2026, will determine control of all 435 House seats and 33 Senate seats. With President Trump in the White House, these elections function as a national referendum on his second term agenda.
Historically, the party holding the White House loses an average of 26 House seats in midterm elections. Republicans currently hold a razor-thin majority. This structural disadvantage is the primary driver behind elevated Democratic odds on Polymarket heading into November.
- House control — Democrats are heavy favorites; Republicans need to defy historical midterm patterns
- Senate control — A genuine toss-up; market has flipped multiple times in 2026
- Democratic sweep — Lower probability but the single most-traded outcome by volume
How to Read These Odds?
The percentages shown in the tracker represent implied probability, the market’s collective estimate that a given outcome occurs by election day. Here’s what each metric means:
The market-implied chance a party wins control. Above 70% = strong favorite. Below 55% = genuine toss-up.
Total dollars bet on that market. Higher volume = more traders = more reliable signal. $1M+ is considered highly liquid.
The probability of each specific House + Senate combination, sweep, split, or status quo.
The Probability Scale
Every percentage you see on this page sits somewhere on this scale. Click the examples below to see where current midterm odds land.
What Drives Polymarket Odds on the 2026 Midterms?
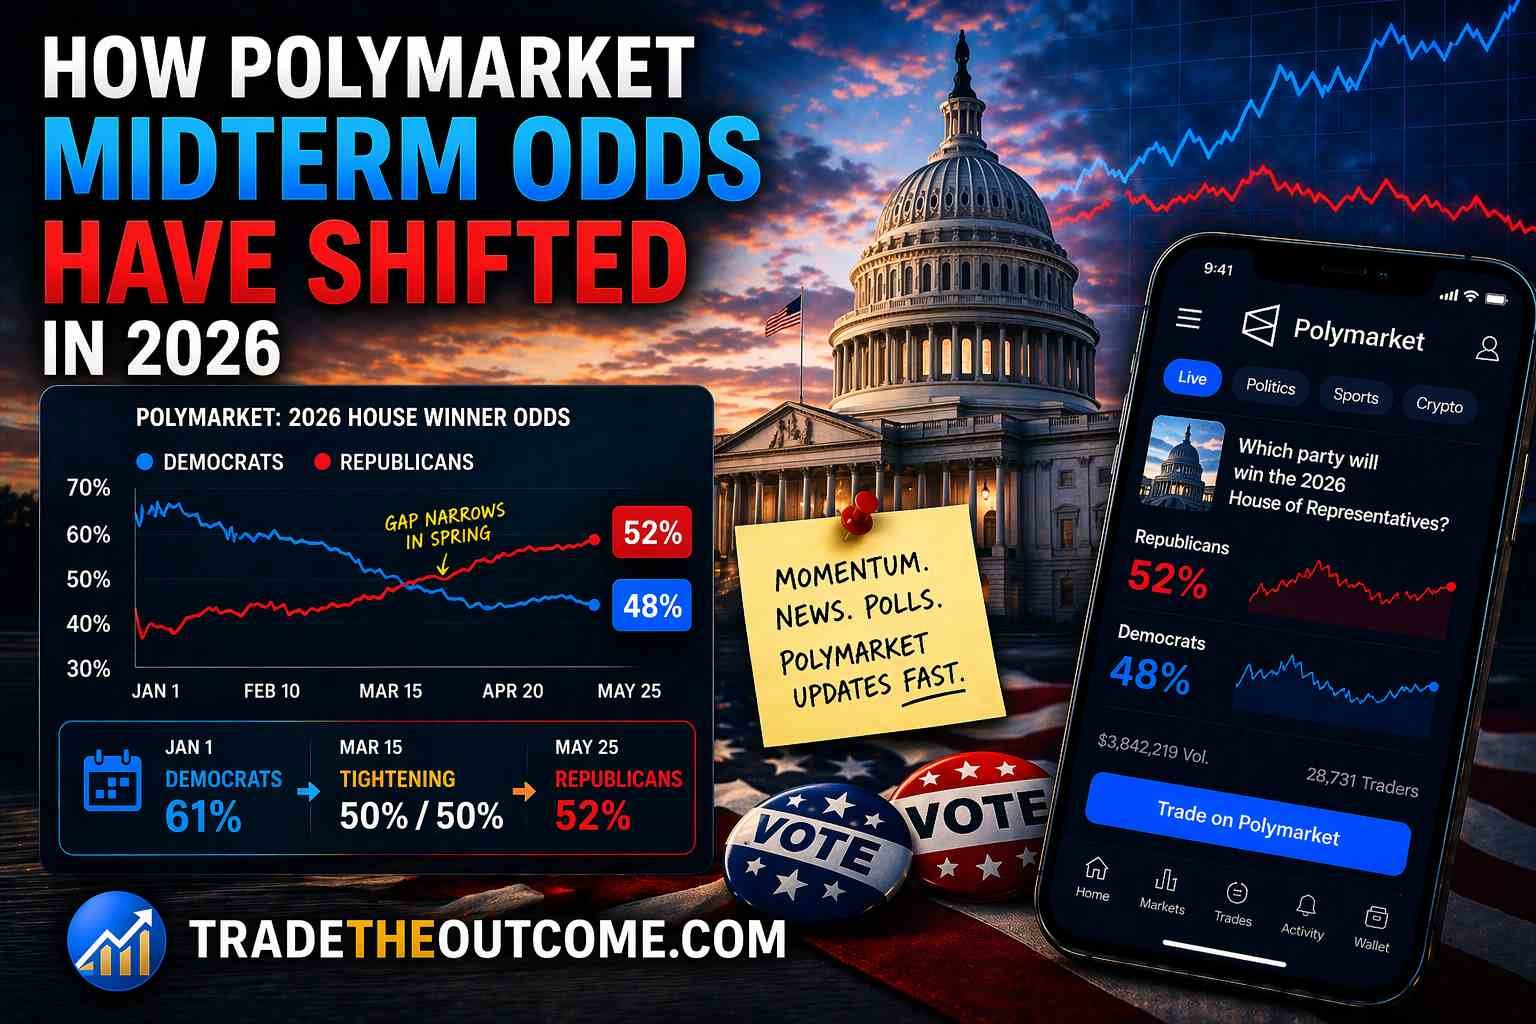
Prediction market odds shift in real time in response to news events. The chart below shows how odds have moved throughout 2026. The four biggest drivers have been:
Consumer sentiment, inflation data, and tariff impacts directly move midterm odds. Negative economic news pushes Democratic odds higher as voters punish the incumbent party.
Presidential approval is the single strongest predictor of midterm outcomes. Sustained approval below 45% historically correlates with significant House seat losses for the incumbent party.
Individual district results before November function as early signals. Prediction markets often reprice sharply after special election outcomes, treating them as real-world data updates.
The 2026 tariff announcements, government shutdown debates, and foreign policy developments each caused notable swings in Polymarket odds, sometimes 5-10 percentage points in a single day.
2026 Senate Battleground Races
While national control markets tell the big picture, individual Senate race markets reveal where the election will actually be decided. The races below are the most competitive and most-traded on Polymarket, each one a potential seat-flip that could determine which party controls the Senate after November 2026.
A Democratic Senate majority requires flipping at least 4 seats while holding all current Democratic-held seats. The markets below show where traders believe the tightest contests will be.
Senate Race Fundraising Tracker
Real money raised + live market odds for the 4 most competitive 2026 Senate battlegrounds.
| State / Race | 🔵 Dem Win% | 🔴 Rep Win% | Favored | Volume | Trade |
|---|---|---|---|---|---|
How Accurate Are Prediction Markets?
Academic research consistently finds prediction markets outperform traditional polling. The mechanism is straightforward, financial incentive forces accuracy. A trader who bets based on wishful thinking loses real money, creating a self-correcting dynamic that opinion polls lack entirely.
For the 2026 midterms specifically, with over $10 million in trading volume across major markets, the Polymarket odds carry substantial weight as forecasting signals. That said, markets are not infallible. They can lag on breaking news, and thin-volume markets can be temporarily manipulated. The national control markets, with their high volume, are considered the most reliable.
Frequently Asked Questions
When do the 2026 midterm elections take place? +
The 2026 midterm elections are held on November 3, 2026. All 435 House seats and 33 Senate seats are contested. Results will determine which party controls Congress for the remaining two years of President Trump's second term.
How many seats do Democrats need to flip the House? +
Republicans currently hold a slim majority. Democrats need a net gain of approximately 5–7 seats to take control of the House, depending on the outcomes of pending special elections before November 2026.
Are Polymarket odds the same as polling averages? +
No. Polymarket odds reflect real-money trader consensus, not survey responses. They are more forward-looking and reactive to breaking news. Polls typically lag by days or weeks; prediction market odds update in minutes.
Where can I trade on the 2026 midterms? +
You can trade directly on Polymarket ↗. Markets are available for House control, Senate control, balance of power, and individual Senate and House races. New users can sign up and fund with crypto or card.
How often are the odds on this page updated? +
The live tracker pulls directly from the Polymarket API and refreshes every hour automatically. No manual updates are needed — every visit shows the latest odds.
Can I trade these markets myself? +
Yes — Polymarket is open to traders globally (with some regional restrictions). Each share pays out $1.00 if your outcome wins, and $0 if it loses. You can buy and sell positions before the election just like a financial market.
Live odds displayed on this page are sourced directly from the Polymarket prediction market API. Data is cached and refreshed hourly. Volume figures represent total dollars traded on each market as of the last refresh. All percentages represent implied win probability calculated from last-trade prices. This page is published by TradeTheOutcome.com — a prediction market analysis blog.
Last data refresh: loading…
What Is America Searching For?
Real-time Google search interest reveals public attention around the 2026 midterms — often a leading indicator before polls move.