

When a single trader netted $553,000 betting on Iran’s supreme leader fate, it signaled something sophisticated players already knew: Iran‑related prediction markets offer extraordinary alpha opportunities when fundamentals diverge from surface prices.
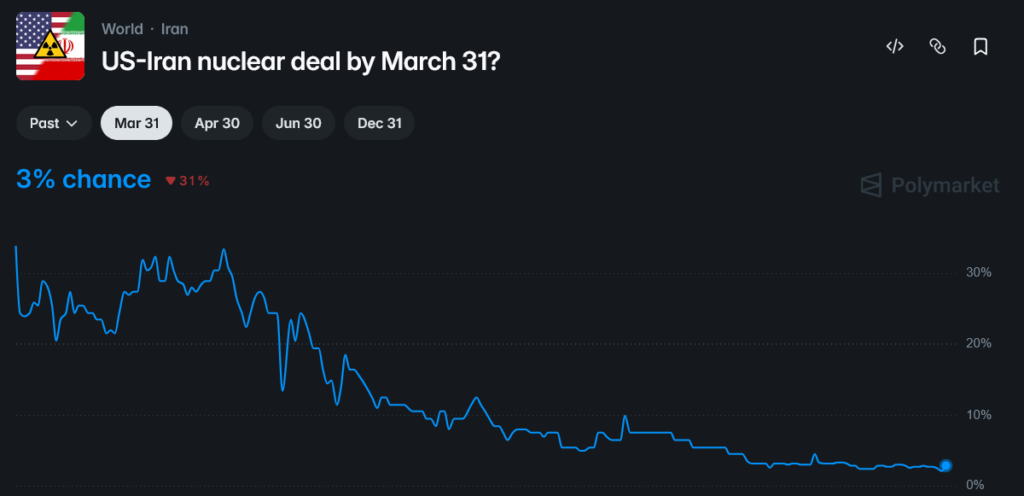
Today, Polymarket’s “US‑Iran nuclear deal by March 31” market sits at a seemingly negligible 3% chance of resolution “Yes”, yet boasts $1.1 million in trading volume, a paradox that reveals not market inefficiency, but sophisticated layered positioning.
This article dissects why the 3% figure dangerously oversimplifies reality, what smart money is actually accumulating beneath the surface, and how to structure positions for maximum asymmetric return as March 31 approaches.
The Current Polymarket Iran Landscape
Polymarket hosts multiple interlocking Iran‑related contracts, each revealing different trader expectations.
Key markets snapshot (March 18, 2026):
- US‑Iran nuclear deal by March 31: 3% Yes, $1.1M volume
- US‑Iran ceasefire by March 31: 13% Yes, $10.5M volume
- US‑Iran nuclear talks resume by March 31: 100% Yes (effectively settled)
- Will the Iranian regime fall by April 30: 16% Yes
- US/Israel strike on Fordow facility by March 31: 21% Yes, $453K volume
- US‑Iran nuclear deal by June 30: 19% Yes, $841K volume
- US‑Iran ceasefire by December 31: 73% Yes
The stark contrast between the March 31 nuclear deal market (3%) and the March 31 ceasefire market (13%) tells the first layer of the story: traders see de‑escalation as more likely than formal nuclear agreement in the immediate term, but both remain profoundly undervalued relative to geopolitical realities.
Why 3% Is a Dangerous Misreading: The Anatomy of a Mispriced Market
The resolution criteria trap
Polymarket’s nuclear deal market requires “an official announcement by the United States and or Iran” or “overwhelming consensus of credible reporting.” This creates a binary outcome problem: either a formal signing ceremony occurs (unlikely in 28 days) or it doesn’t.
However, this misses how markets actually function, traders aren’t betting solely on March 31 resolution, but on:
- Option value: positioning for unexpected diplomatic breakthroughs
- Volatility capture: profiting from price swings as news develops
- Cross‑market arbitrage: exploiting mispricings between related contracts
- Information asymmetry: acting on non‑public diplomatic signals
The volume‑price divergence signal $1.1 million in volume on a 3% market indicates intense trader interest disproportionate to the implied probability.
For context, the March 31 ceasefire market has $10.5M volume at 13% Yes, and the June 30 nuclear deal market has $841K volume at 19% Yes.
This suggests sophisticated players are using the March 31 contract as a volatility vehicle rather than a pure directional bet, accumulating shares cheaply to sell into news‑driven spikes or hedge against escalation scenarios.
What Smart Money Is Really Tracking?
Backchannel progress vs public posturin
Recent talks in Geneva showed “substantial progress” according to mediators, despite Trump’s public dissatisfaction and Tehran’s hard‑line rhetoric reported in outlets like Reuters and the BBC.
Iranian officials continue to signal flexibility while maintaining public red lines, as detailed by think‑tank coverage from the Arms Control Association.
This dual‑track diplomacy—where concessions emerge quietly while public rhetoric remains hawkish—creates precisely the environment where prediction markets underprice resolution probability.
Military action as diplomatic catalys
Counterintuitively, recent US‑Israeli strikes on Iranian nuclear facilities, including reported damage to Natanz in early March covered by the Critical Threats Project and the Institute for the Study of War, may actually increase deal likelihood by:
- Demonstrating credible military threat that concentrates Iranian leadership minds
- Creating domestic pressure in Iran for sanctions relief amid economic strain
- Establishing clear red lines that make negotiated boundaries easier to define
The regime‑fall market’s drop from roughly 40% to just above 20% after the supreme leader strike, as noted in coverage from the Wall Street Journal, shows traders understand this dynamic—military action increases negotiation urgency rather than eliminating deal prospects (WSJ live markets coverage).
Regional escalation triggers timeline compression
With Hormuz Strait tensions rising and oil‑related infrastructure increasingly in the crosshairs—outlined in Iran war live blogs from Al Jazeera and UN Security Council debates over Iran’s nuclear programme (UN press), each escalation event creates a new negotiation inflection point.
Traders watching the ceasefire markets (13% March 31, 58% June 30, 73% December 31) see a clear timeline preference, but often fail to recognize that nuclear deal probability follows a similar, albeit delayed, trajectory.
Smart Money Signals: Where Volume Reveals Conviction
Independent analytics like PolyMonit’s March 2026 leaderboard show Geopolitics as the top profit category, indicating sophisticated players are actively positioning in exactly these markets.
The March 31 nuclear deal contract’s volume profile suggests:
- Steady accumulation during periods of negative news (strikes, public breakdowns)
- Profit‑taking during diplomatic optimism spikes
- Hedging against regime‑change scenarios via correlated markets
Cross‑market arbitrage opportunities
The persistent gap between nuclear deal and ceasefire probabilities creates exploitable relationships:
- If ceasefire reaches 50%+ before the nuclear deal market trades near 20%, there is a case for accumulating cheap nuclear‑deal YES shares as a correlated upside bet.
- If the nuclear deal spikes above 25% while regime‑fall markets such as “Will the Iranian regime fall before 2027?” remain depressed, mean‑reversion shorts on the deal or long positions in regime‑stability markets can make sense.
- Year‑end nuclear outcomes can be approximated via high‑odds ceasefire contracts, offering better value for traders willing to hold through volatility.
A Trading Framework for March 31 Positioning
Scenario 1: Diplomatic breakthrough (roughly 15–25% probability)
- Trigger: a joint announcement, verified IAEA inspection framework, or sanctions‑relief outline, as sketched in Reuters explainer pieces on what a deal might entail.
- Position: long March 31 nuclear deal YES at low single‑digit prices for 30x+ payoff potential.
- Hedge: short regime‑fall or conflict‑escalation markets that would likely re‑price sharply lower on credible deal news.
- Exit: take partial profits on the first wave of confirmation headlines, then trail the remainder as details emerge.
Scenario 2: Continued stalemate (around 60–70% probability)
- Trigger: talks keep grinding without a breakthrough, with periodic strikes but no decisive escalation—similar to the “no deal but signs of progress” pattern described in US‑Iran talks coverage.
- Position: March 31 nuclear deal stays range‑bound in the 2–5% zone.
- Strategy: treat the contract as a volatility instrument, sell into optimism spikes, re‑accumulate on pessimism, or use options structured exposure where available.
- Watch: volume spikes and order‑book shifts that signal large players repositioning ahead of key diplomatic dates.
Scenario 3: Escalation to crisis (10–15% probability)
- Trigger: a major attack on nuclear sites, significant naval clash in the Gulf, or clear signs of regime instability, as tracked in real time by security analysts like the Critical Threats Project and ISW.
- Position: March 31 nuclear deal approaches zero, but medium‑term deal markets and ceasefire contracts become key hedging tools.
- Alternative: long June 30 or later nuclear‑deal markets that could spike if a crisis forces negotiations, or short near‑term ceasefire markets that have not yet fully priced escalation.
Key volatility catalysts to monitor
- Weekly IAEA reports and leaks on enrichment levels, often summarized in policy analysis from organizations like the Arms Control Association.
- US and Iranian domestic political developments that shift negotiation incentives, tracked in overviews such as the Wikipedia entry on 2025–2026 Iran–US negotiations.
- Any major incident in or around the Hormuz Strait, highlighted by outlets like Al Jazeera’s live war coverage or Reuters.
- Large shifts in Polymarket order books, which can be cross‑checked using tools such as PolyMonit.
Risk Management: When to Re‑Evaluate Your Thesis
Your thesis is at risk if:
- March 31 ceasefire probabilities collapse and stay low despite diplomatic calendar milestones.
- Regime‑fall markets re‑rate sharply higher at the same time nuclear‑deal and ceasefire markets fail to recover.
- Daily volume in key Iran markets dries up, signalling that the smart‑money crowd has moved on to other themes.
Given the asymmetric nature of these trades, many experienced prediction‑market traders size core positions modestly (1–2% of bankroll) and use additional, smaller allocations for volatility plays and hedges across correlated markets.
The Asymmetric Opportunity in Plain Sight
US-Iran Nuclear Deal by March 31?
Polymarket traders are pricing an extremely low probability that a US–Iran nuclear deal will be finalized by March 31. With odds near the floor, the market reflects skepticism around ongoing negotiations, unresolved enrichment disputes, and geopolitical tensions that make a short-term agreement highly unlikely.
Disclosure: This link may be an affiliate link. I may earn a commission at no extra cost to you.
While Polymarket’s 3% headline probability for a US‑Iran nuclear deal by March 31 grabs attention, the real story lies in the seven‑figure volume and cross‑market structure that reveal what sophisticated traders are actually doing.
The question isn’t simply “deal or no deal by March 31,” but how quickly markets will reprice once back-channel progress, military pressure, and regional escalation finally converge into a visible diplomatic outcome.
For traders willing to think in probabilities rather than headlines, Iran’s nuclear‑deal markets offer exactly what makes prediction markets valuable: misalignment between surface odds and layered reality, and the chance to be positioned before everyone else catches up.
