
![A digital infographic titled 'US x IRAN CEASEFIRE BY? | POLYMARKET PREDICTION MARKET ANALYSIS'. At the center, two hands shake—one with a US flag sleeve and the other with an Iranian flag sleeve, holding a white peace dove. The background features a glowing world map with stylized financial trend lines. On the left is the US Capitol building, and on the right is Tehran's Milad Tower and a mosque. A Polymarket chart overlay asks 'Will the US & Iran sign a ceasefire agreement by [Month] [Year]?' showing a 25% probability. Floating callouts ask about sanctions and nuclear deal odds. At the bottom are trading buttons for 'YES 25c' and 'NO 75c' with a total volume of $1.2M"](https://tradetheoutcome.com/wp-content/uploads/2026/03/US-x-Iran-Ceasefire-By-Polymarket-Analysis-scaled.jpg)
The geopolitical landscape between the United States and Iran remains fraught with complexity, proxy skirmishes, and entrenched friction. For prediction market traders on Polymarket, the question isn’t just if a ceasefire or mutual de-escalation will occur, but when.
The current Polymarket event, “US x Iran ceasefire“, paints a fascinating picture of market sentiment. However, when juxtaposed against real-world intelligence and diplomatic silence, a stark divergence emerges.
Here is a data-backed analysis of the market, the on-the-ground reality, and how to navigate these contracts wisely.
US x Iran Ceasefire By?
This Polymarket event tracks when traders believe a ceasefire between the US and Iran could occur. Current market pricing suggests later timelines are more likely, with longer-term outcomes dominating probability as diplomatic efforts remain uncertain amid ongoing conflict escalation.
Disclosure: This link may be an affiliate link. I may earn a commission at no extra cost to you.
The Polymarket Data: A Timeline of Optimism
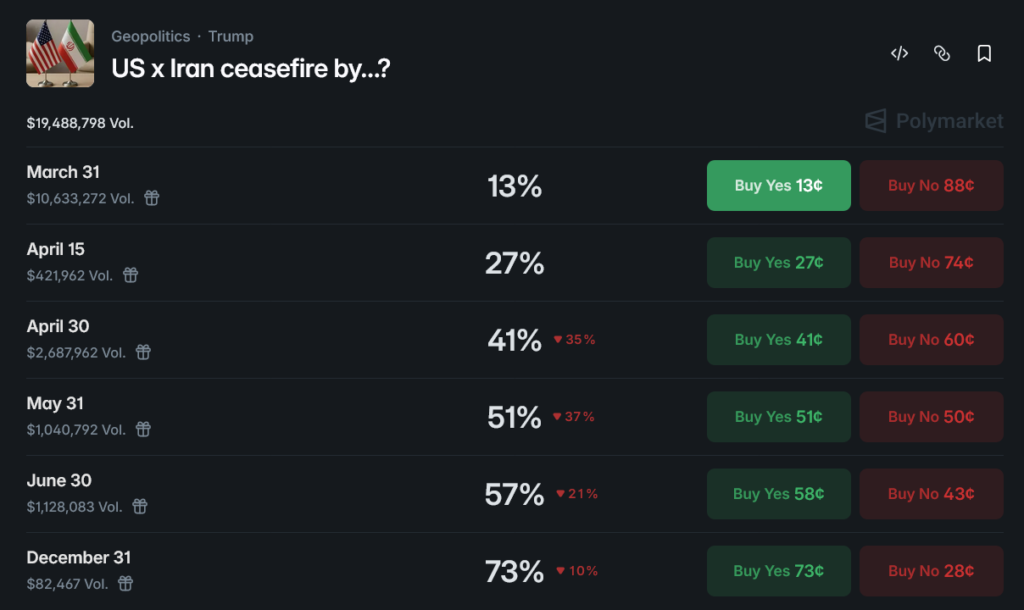
Looking at the current Polymarket order book, traders are pricing in a progressive likelihood of a ceasefire as the year goes on:
- March 31: 10% chance
- April 30: 22% chance
- June 30: 30% chance
- July 31: 46% chance
- October 31: 67% chance
- December 31: 71% chance
The market is essentially saying that while a short-term resolution is highly unlikely, a de-escalation by the end of the year is more probable than not. But does the geopolitical data support this?
The Market Context: Entrenched Friction
The short answer is: the market is likely overestimating the likelihood of a late-year resolution.
Recent intelligence and geopolitical movements indicate zero significant progress toward a US-Iran ceasefire. The reality on the ground contradicts the escalating optimism seen in the July-December Polymarket contracts:
Proxy Hostilities Over Direct Diplomacy: Tensions are actively escalating. Israel continues operations against Hezbollah, and Iranian missile threats persist.
Concurrently, US strikes on Houthi targets in Yemen are ongoing. These actions underscore a commitment to proxy warfare and containment rather than de-escalation.
Radio Silence on the Diplomatic Front: The traditional back-channels, particularly via Oman, remain completely quiet. Official statements from both Washington and Tehran are heavily focused on deterrence.
The Goal is Containment, Not Truce: The current strategic objective for the US is visibly centered on containing Iranian influence in the region, rather than rushing to the table for a bilateral truce.
Absent any mutual halt announcements or even whispers of preliminary talks, the foundational elements required for a ceasefire are missing.
Strategic Trading Advice: What to Do With This Data
The divergence between the geopolitical reality and the Polymarket odds presents distinct opportunities for the pragmatic trader.
The market appears to be trading on “hopium” or timeline fatigue rather than concrete diplomatic signals.
Here is how to approach these contracts wisely:
1. The Short-Term “No” is a Grind, but Grounded in Reality
With March 31 fast approaching and diplomatic channels dead, a sudden, unannounced ceasefire is practically impossible. While the “Yes” probability for March 31 sits at a low 10%, buying “No” at 90¢ ties up capital for a small yield.
However, it is statistically the safest bet on the board. The same logic applies to April 30 (22%). The friction is too entrenched to unravel in 45 days.
2. Fade the Late-Year Optimism
The most glaring inefficiencies in this market are the October (67%) and December (71%) contracts. A 71% implied probability of a ceasefire by year-end suggests that wheels are already in motion. The data firmly states they are not.
- Actionable Angle: Buying “No” on the October or December contracts offers significant value. You are effectively betting that the status quo of proxy hostilities and deterrence will persist—a stance heavily supported by current intelligence. At 29¢ to 33¢ for a “No” share, the risk-to-reward ratio strongly favors those betting against a late-year diplomatic miracle.
3. Watch for the “Oman Signal”
If you are holding positions in this market, the leading indicator to watch isn’t military action; it is diplomatic chatter out of Oman or Qatar.
Until trusted intermediaries report active, sustained dialogue, any spike in “Yes” probabilities across these contracts should be viewed as irrational market exuberance and an opportunity to fade the rally.
The Bottom Line
Don’t let the escalating percentages on the Polymarket interface fool you. The geopolitical data points to sustained, long-term friction. Trade the reality, not the timeline.
